Tips for drawing a normal distribution
 Subscribe to Decision Science News by Email (one email per week, easy unsubscribe)
KNOW THY INFLECTION POINT
Click to Enlarge
We have drawn a lot of sorry-looking normal distributions in our life. It’s a shape that’s hard to get down without a lot of practice.
Here’s a few tips that can make it easier.
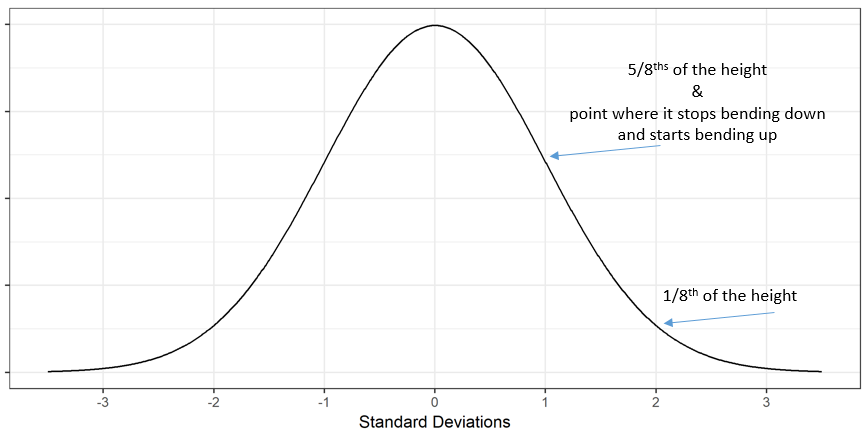
- Start by marking out standard deviations on the x axis from -3 to +3
- At x=0, draw a point to be the top of the bell curve
- At ± 1 SDs draw points at about 5/8ths of the height
- At ± 2 SDs draw points at about 1/8th of the height
- At ± 3.25 SDs draw points on the X axis
Now, to get the bends right, we exploit the following cool fact: There is an inflection point at ±1 standard deviation. That is,
At 1 standard deviation, the curve stops bending down and starts bending up.
Draw through those points and voila, normal distribution!
You might be wondering if these tips are approximations or exact. The heights of the points are approximate but within 1-2% of the exact values. The inflection point at ± 1 SD is real. That’s right, the second derivative is 0 at exactly ± 1 standard deviation.
RELATED BUT DIFFERENT DSN POST
How to eyeball a standard deviation
R CODE FOR THE PLOTS


It is good for everyone to know that the inflection points of a normal curve are at +/- 1 sd, but all the drawing tips in the world won’t help my arthritic left hand draw a nice normal distribution. I use the computer!
July 29, 2019 @ 12:07 am