What’s the deal with wind chill?
 Subscribe to Decision Science News by Email (one email per week, easy unsubscribe)
WIND SPEEDS UP HEAT LOSS
Twenty years ago, a German colleague asked me what the deal was with wind chill. I guess they didn’t have it in Germany. I explained it was an attempt to communicate how it feels when there is a low temperature combined with wind. But my colleague wanted to know how they get the values in charts like these:
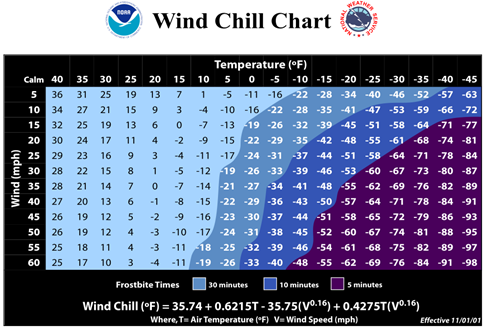
If you look closely at the first chart, it gives the formula for wind chill. It looks pretty hairy but it’s just a function of two things: wind speed and temperature. The windchill in Fahrenheit is just:
35.74 + .6251 * temp – 35.75 * windspeed^.16 + .4275 * temp * windspeed^.16
(Note that windchill is only defined for temperatures below 50°F and wind speeds above 3 mph.)
But where does this equation come from? This brochure has the answer. Researchers put sensors on people’s faces and had them walk in wind tunnels:
During the human trials, 6 male and 6 female volunteers were placed in a chilled wind tunnel. Thermal transducers were stuck to their faces to measure heat flow from the cheeks, forehead, nose and chin while walking 3 mph on a treadmill. Each volunteer took part in four trials of 90 minutes each and was exposed to varying wind speeds and temperatures. The NWS Wind Chill Temperature (WCT) index uses advances in science, technology, and computer modeling to provide an accurate, understandable, and useful formula for calculating the dangers from winter winds and freezing temperatures. The index does the following:
- Calculates wind speed at an average height of 5 feet, the typical height of an adult human face, based on readings from the national standard height of 33 feet, typical height of an anemometer
- Is based on a human face model
- Incorporates heat transfer theory based on heat loss from the body to its surroundings, during cold and breezy/windy days
- Lowers the calm wind threshold to 3 mph
- Uses a consistent standard for skin tissue resistance
- Assumes no impact from the sun, i.e., clear night sky.
A common misunderstanding is to assume that the wind can make something colder than the outside temperature. That can’t happen. Wind just speeds up the chilling process.
Ok, this is all fine, but we wanted a chart that would 1) make it easier to see the effect of the wind speed and temperature and 2) show the wind chill effect for typical February weather in New York and Chicago. We coded up the following:
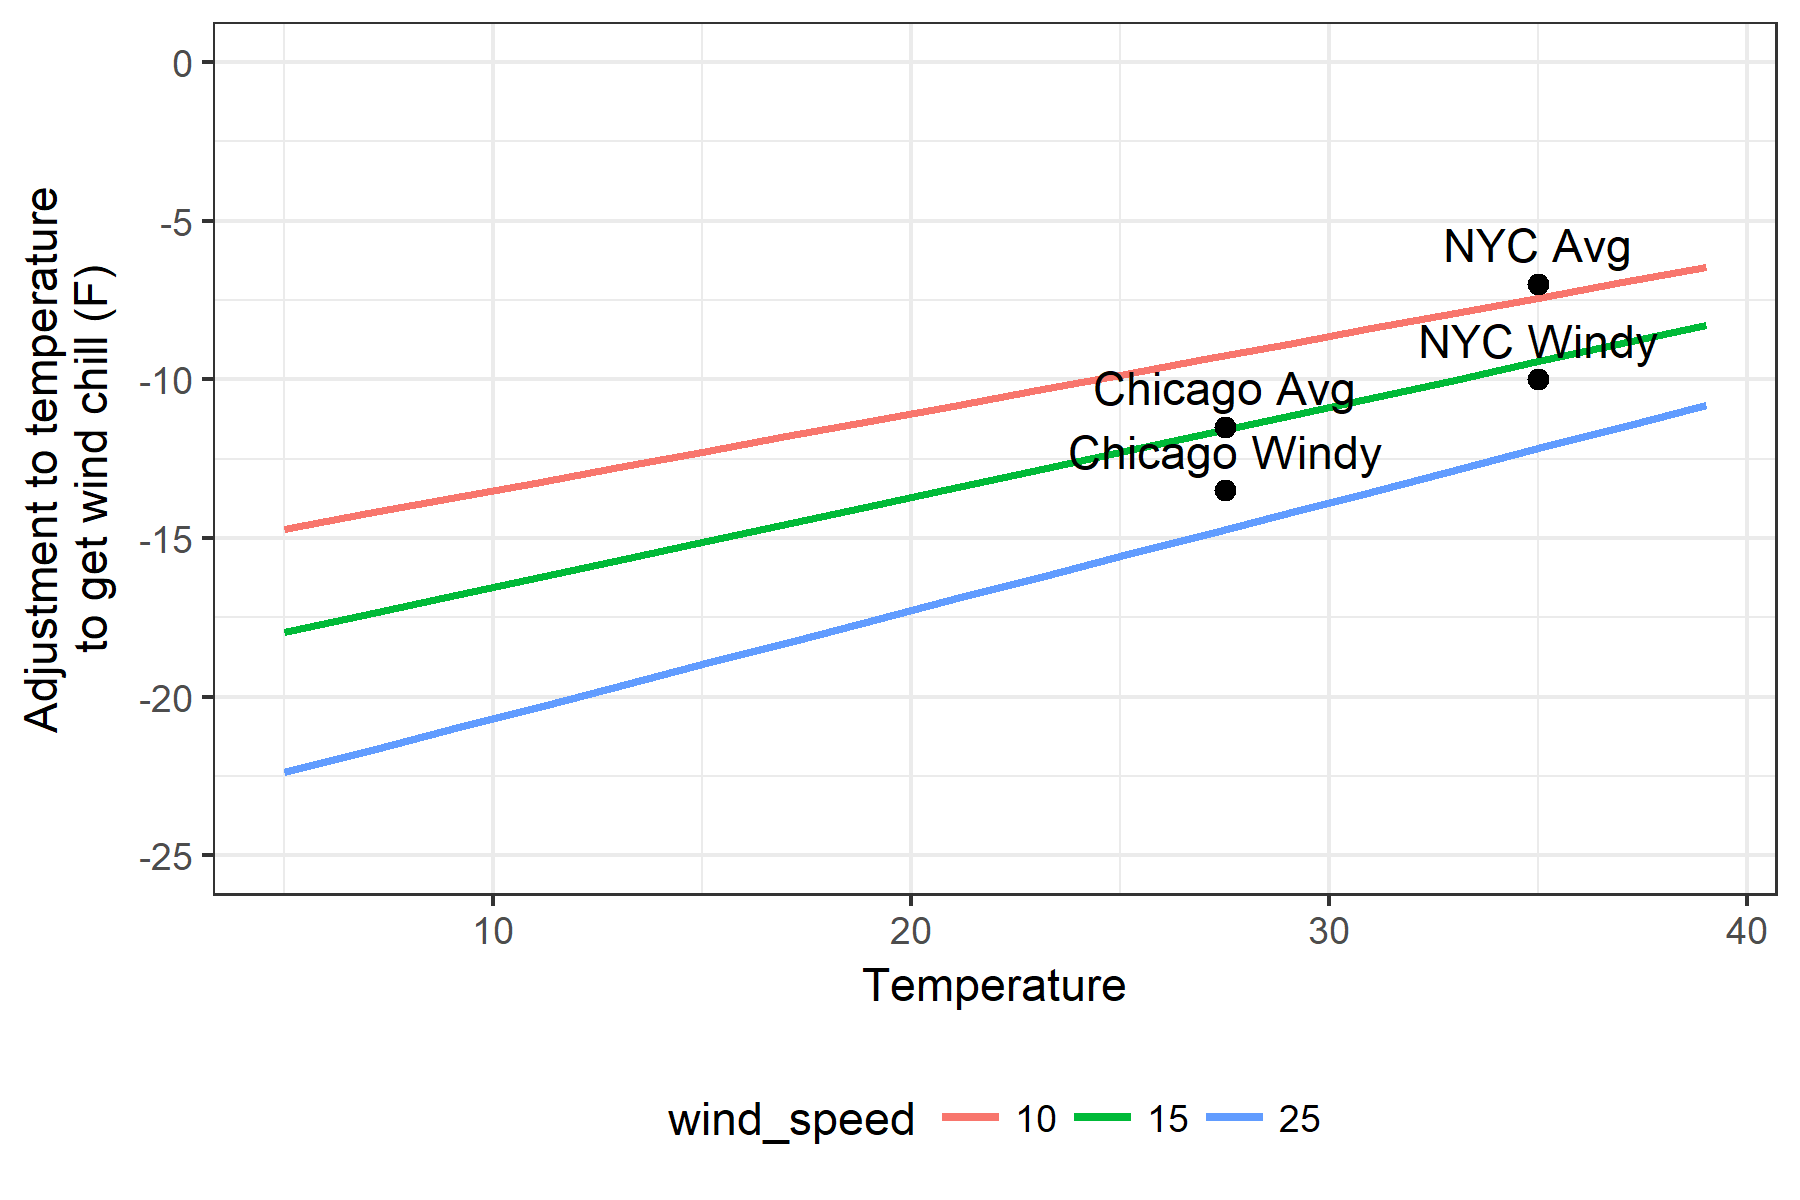
click to enlarge
Note that in this chart, the Y axis isn’t the temperature, it’s the difference between the outside temperature and the windchill: the number of degrees you need to subtract.
So, when the wind is 10 miles per hour (red line), and the temperature is 25 degrees (x axis value of 25), the effect of wind chill is to lower the perceived temperature by 10 degrees (y axis value of -10), but at the same temperature when the wind is 25 miles per hour (blue line), wind lowers perceived temperature by about 16 degrees.
A useful takeaway is that with average winds and average temperatures, the effect of windchill is to lower the perceived temperature by about 7-12 degrees.
(BTW, if you like this stuff, you might enjoy our post on the heat index.)
Want to mess around with the code? Here you go:


For presentation purposes, they should ignore the 3mph threshold. That kink on the right side of the first graph looks awful.
January 22, 2019 @ 5:51 am
Discontinuity!
January 22, 2019 @ 6:28 am