Five kinds of weather you’ll meet in America
 Subscribe to Decision Science News by Email (one email per week, easy unsubscribe)
K-MEANS CLUSTERING, A WORKHORSE OF DATA SCIENCE AND MACHINE LEARNING
CLICK TO ENLARGE
The USA is a large country. How different are people’s experiences of the weather depending on where they live?
To look into this question, we downloaded high temperature data for over 1,300 airport weather stations in the contiguous USA for every day for five years (2012-2016 inclusive).
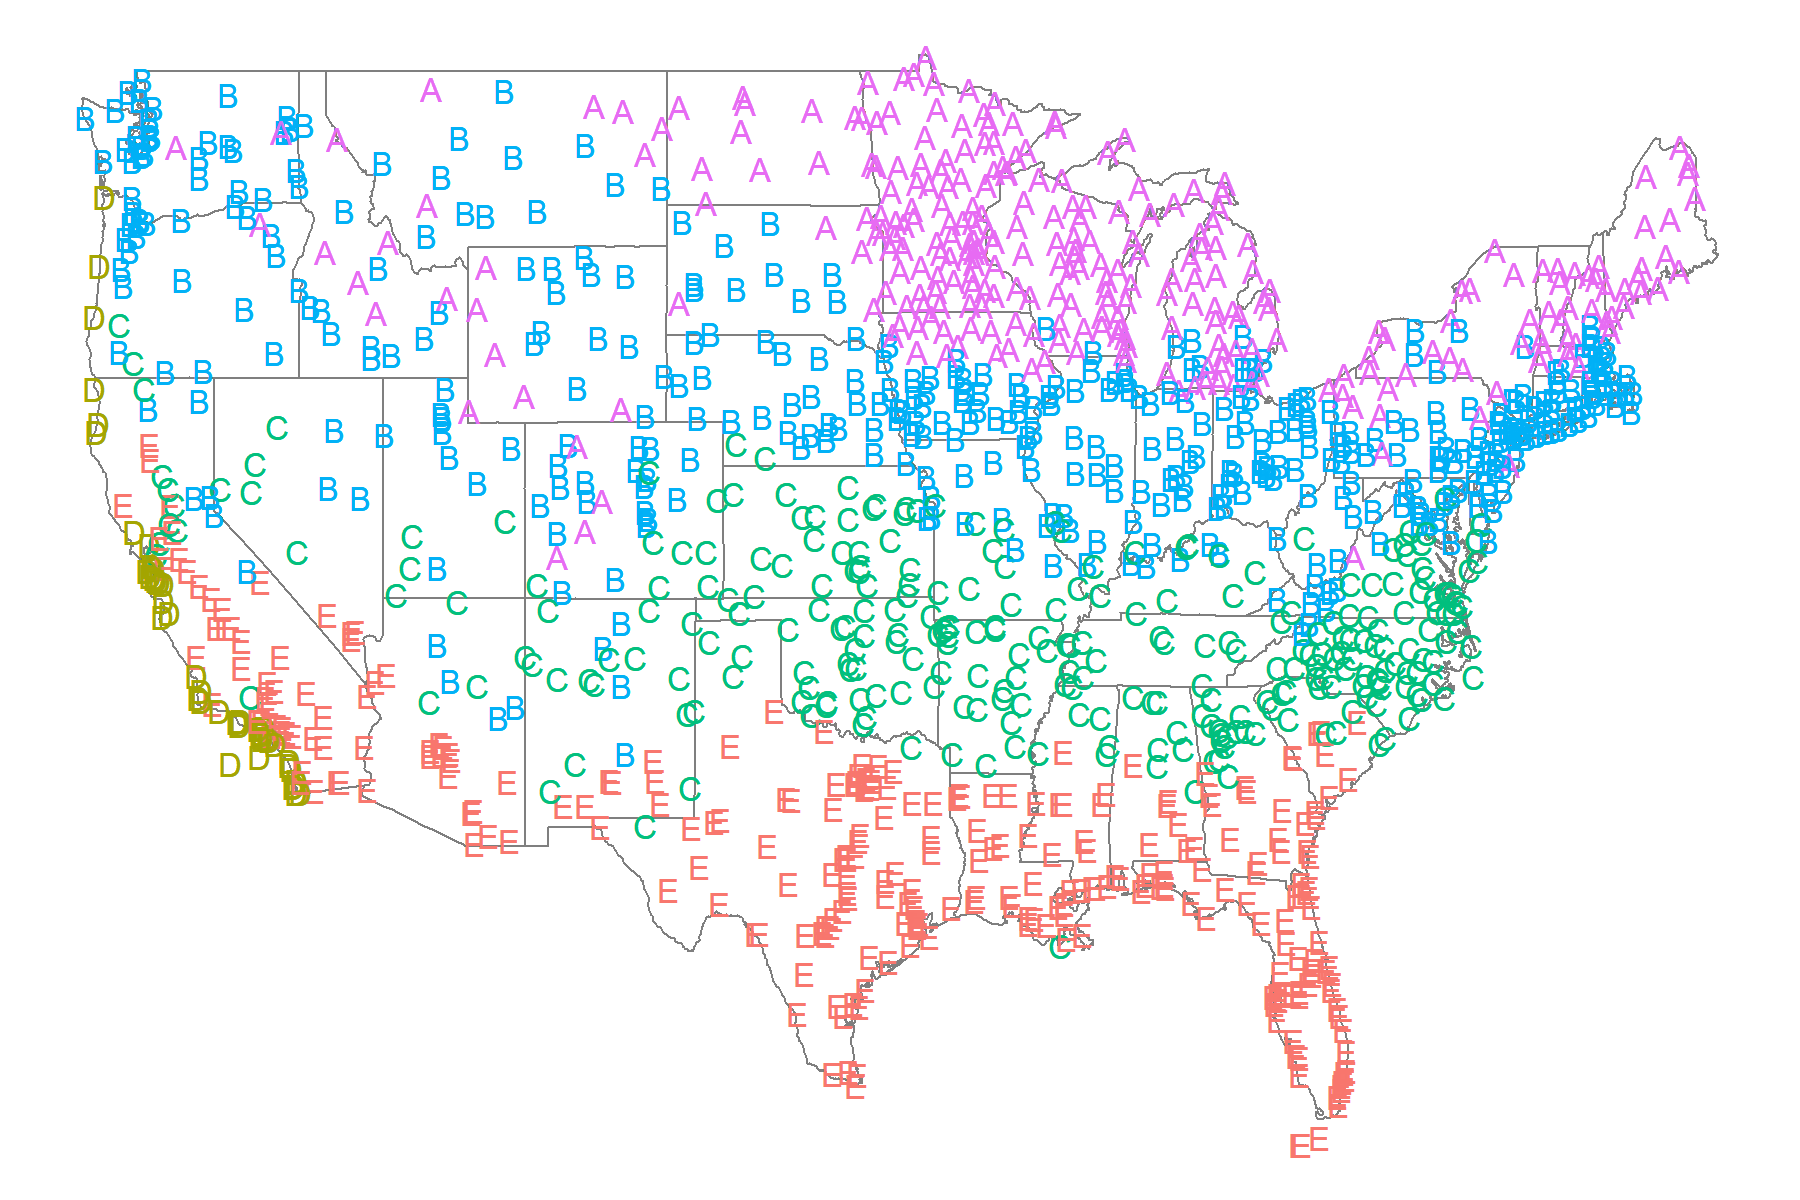
We then used k-means clustering, a workhorse of machine learning, to cluster weather stations according to how similar their high temperatures are.
After some exploring, we settled on five clusters because it captures the gist of what is going on.
The result is shown above, where the letters A through E denote the different clusters (which were ordered by their average temperature in the last week of the year). We see broad East-West stripes, with a few patches of cooler temperatures in the Rocky Mountains, and something unusual going on in coastal California and Oregon.
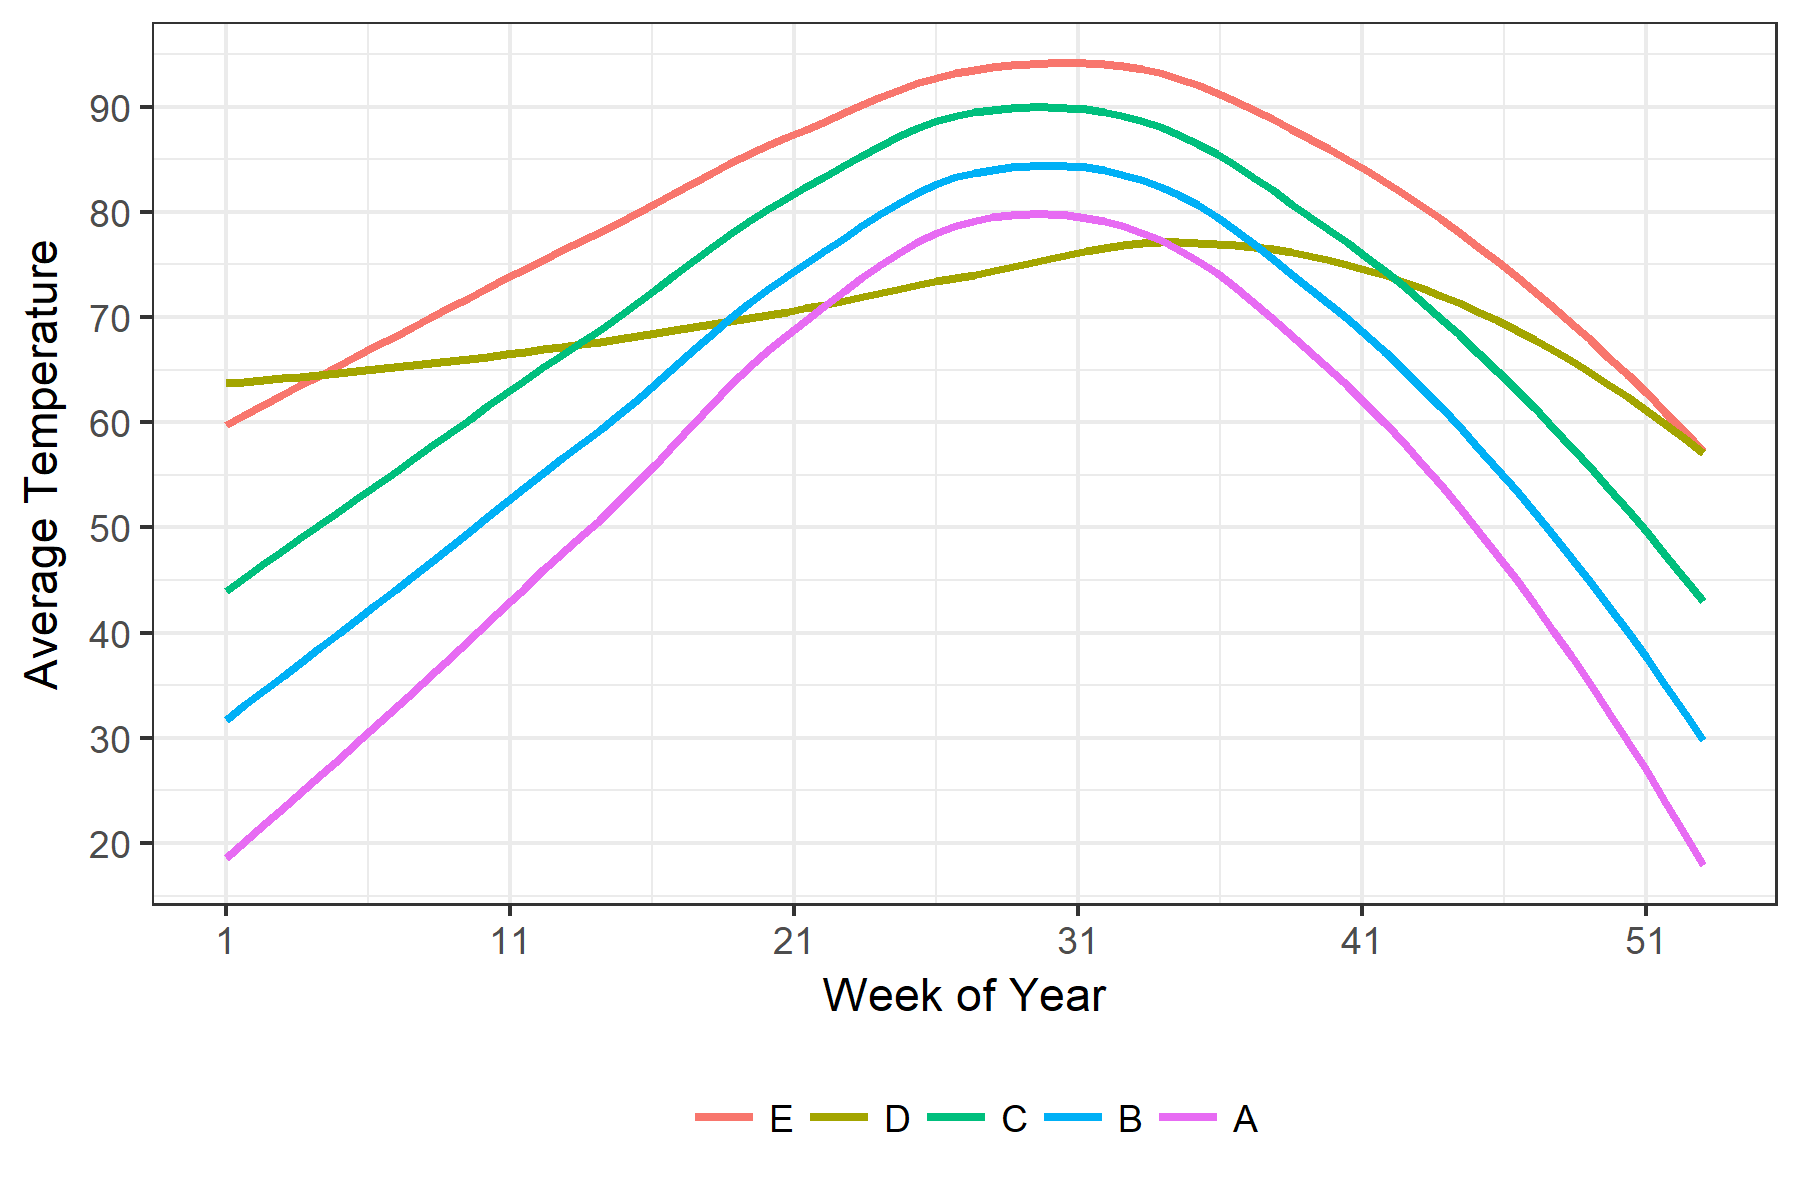
How different are the clusters? To look at this, we plot the smoothed average high temperature in each cluster for each week of the year.
CLICK TO ENLARGE
This was eye opening, and gave us two basic generalizations about the weather in the USA
1. As you more North and South, the temperature patterns are similar, just vertically shifted.
2. The Pacific coast is different
On the Pacific coast, temperatures are pretty steady over the year. California and Florida both have nice warm winters, but when you look at the summers, you can see why they put the movie studios in Hollywood. Low variance makes it easy to plan.
Speaking of variance, look how cluster A (Minnesota and Maine) is actually hotter than cluster D (Pacific Coast) around the middle of the year.
Another cool factoid is that the American experience is pretty similar in summer (less than 20 degrees between cluster A and E) and highly varied in winter (about 45 degrees between cluster D and cluster A).
R, ggplot2, tidyverse, weatherData, etc. code are below for those who wish to reproduce the analysis. We scraped the temperatures ourselves, but we’ll save you the trouble and let you download the temperature data here. Just create a subdirectory called “data” and expand weather_data.zip there. Leave 5 the yearly files in gzip (.gz) because R reads and writes .gz files seamlessly.

