Weighted population density
 Subscribe to Decision Science News by Email (one email per week, easy unsubscribe)
DENSITY THE AVERAGE PERSON EXPERIENCES
CLICK TO ENLARGE
In Alaska, there’s about one person for each square mile of land.
You might picture a typical Alaskan not being able to see the next house.
But it’s not that way of course.
Most of Alaska is uninhabited. People have crowded into a few areas.
The average Alaskan experiences a population density of about 72 people per square mile.
That’s a lot more than one.
In the R code below, we roughly estimate the weighted population density for each US state, that is, the population density that the average person experiences. We do this for each state by taking the average of its counties’ population densities, weighted by the population of each county. It would be even better to do this for smaller areas, such as census tracts, but we were too lazy to chase down the data.
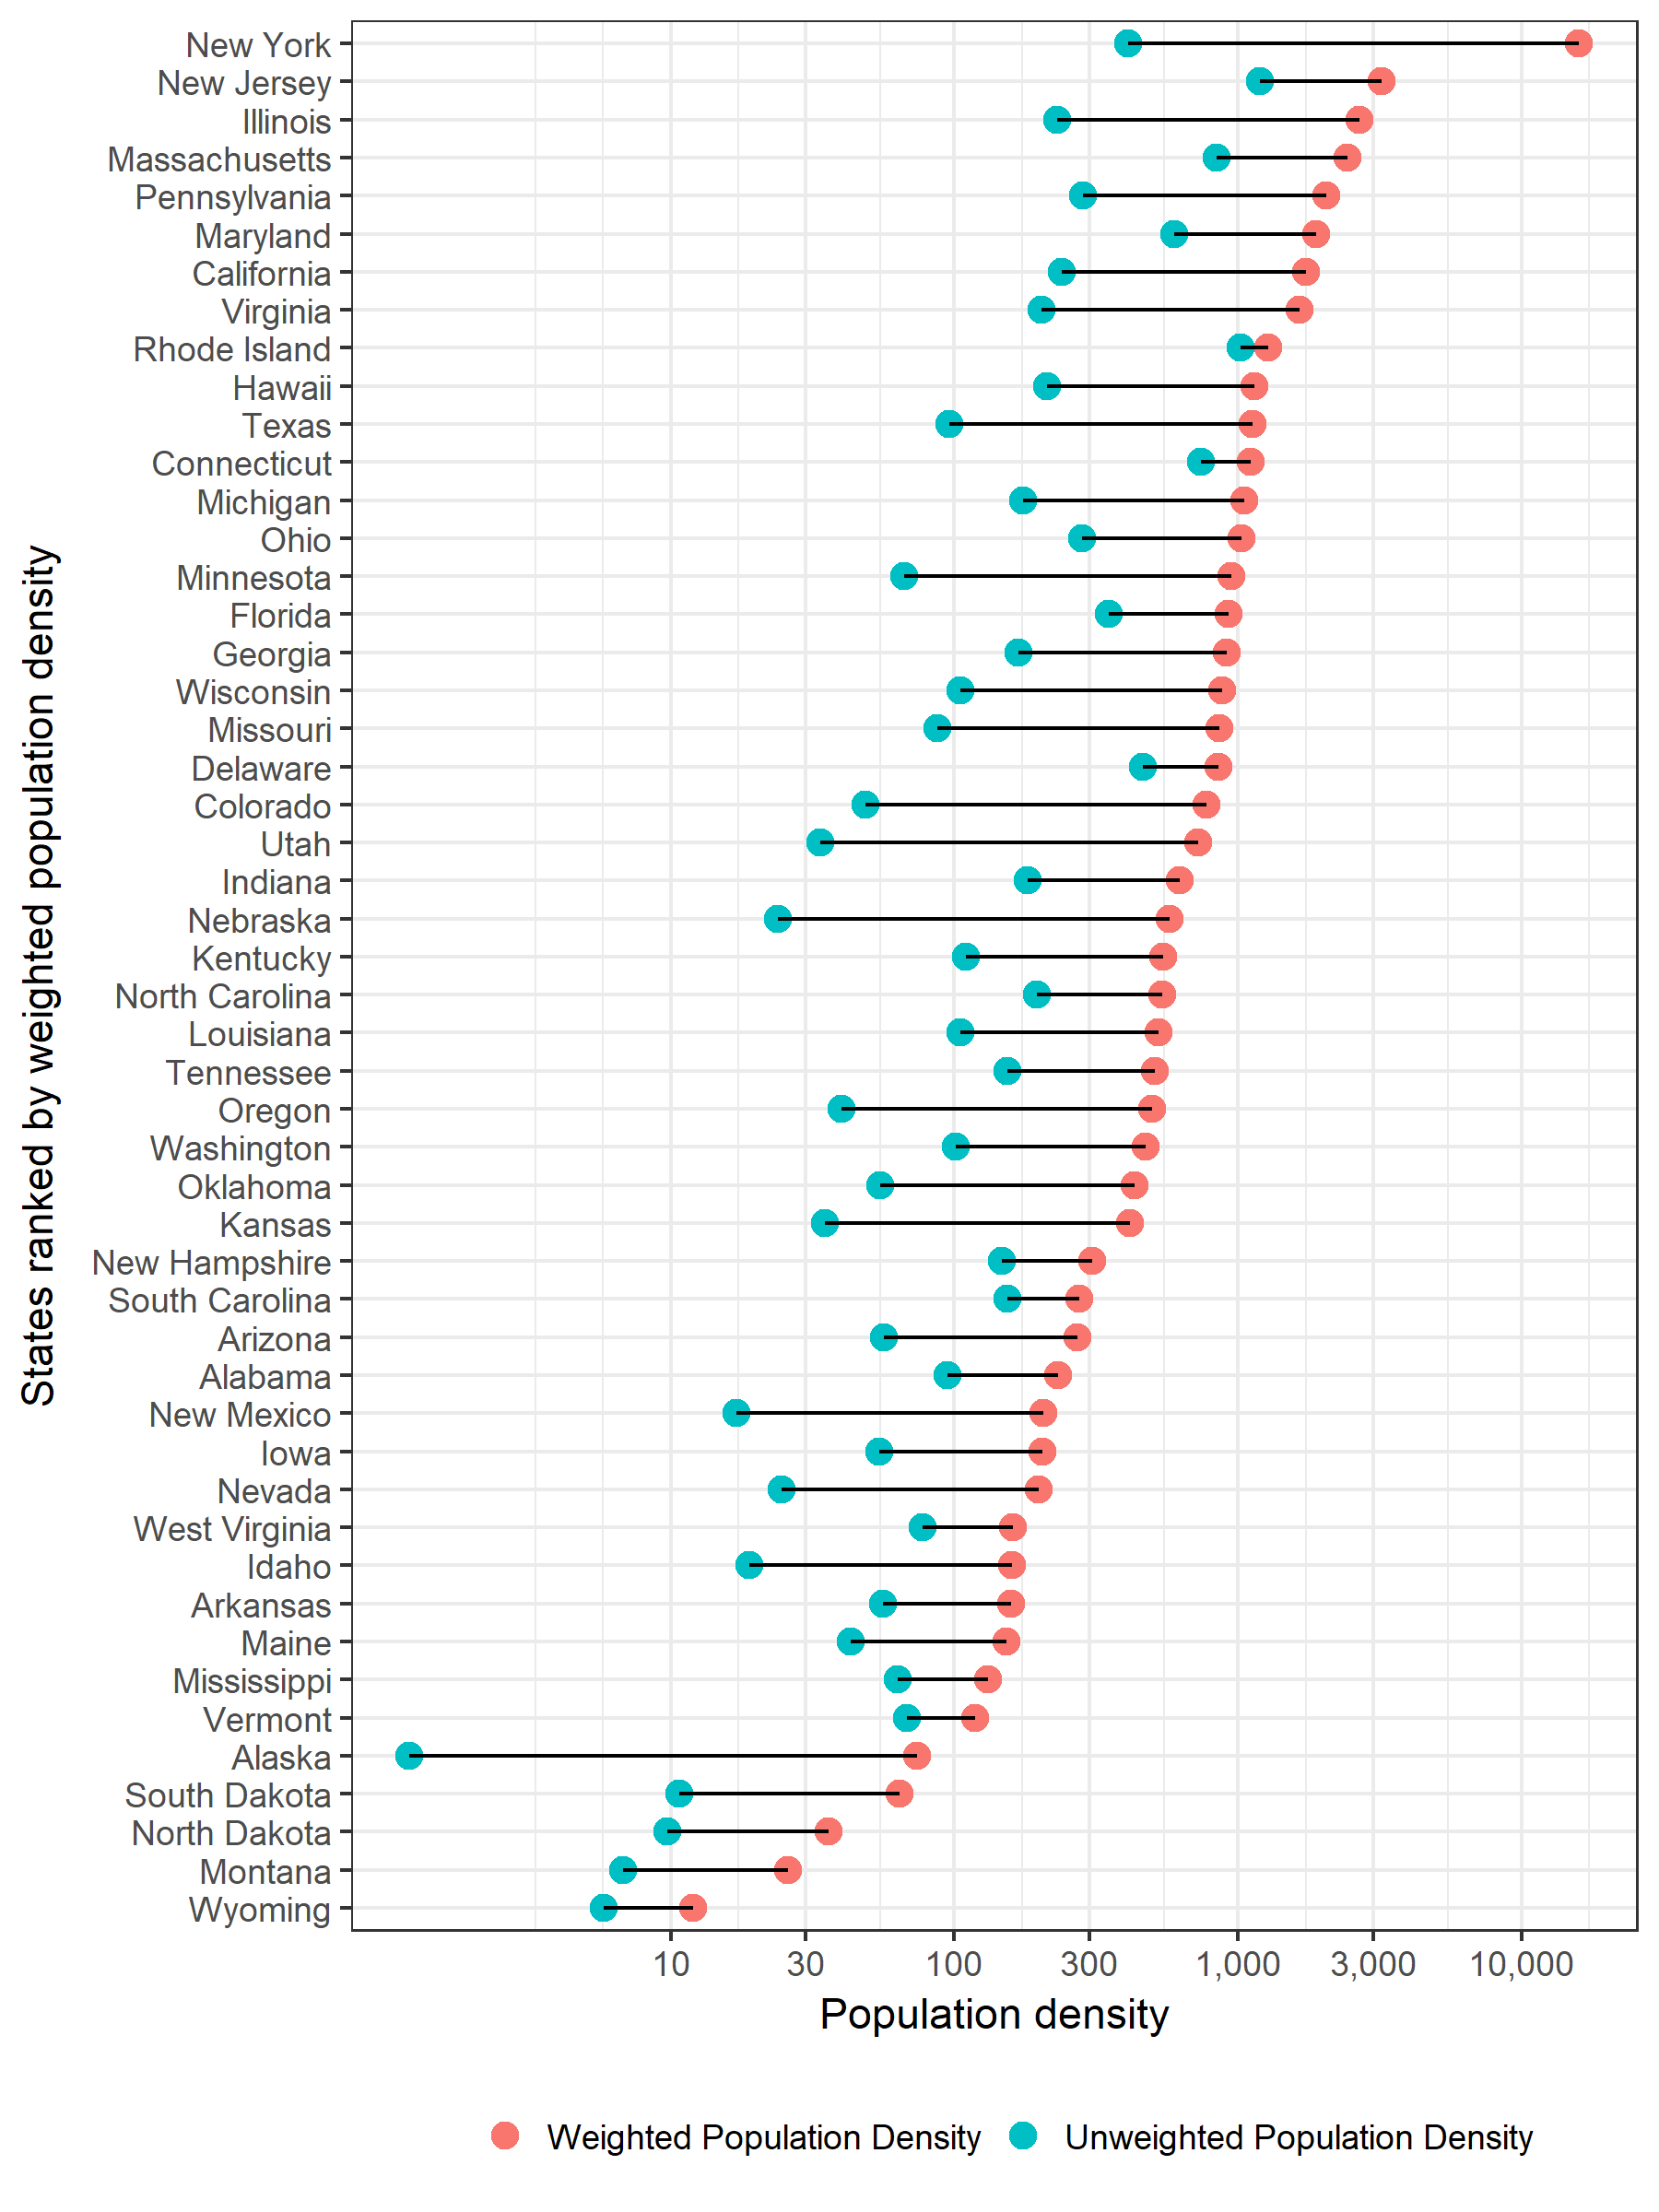
In the figure at the top of this post, we see the weighted and unweighted population densities for each state.
Note how New Jersey has a higher population density than New York, but when you look at what the average person experiences, it flips.
Amazingly, the average person in New York State shares a square mile with more than 10,000 other residents!
What states have the biggest ratios of weighted to unweighted densities? The chart below shows states with a 10x or greater ratio in blue.
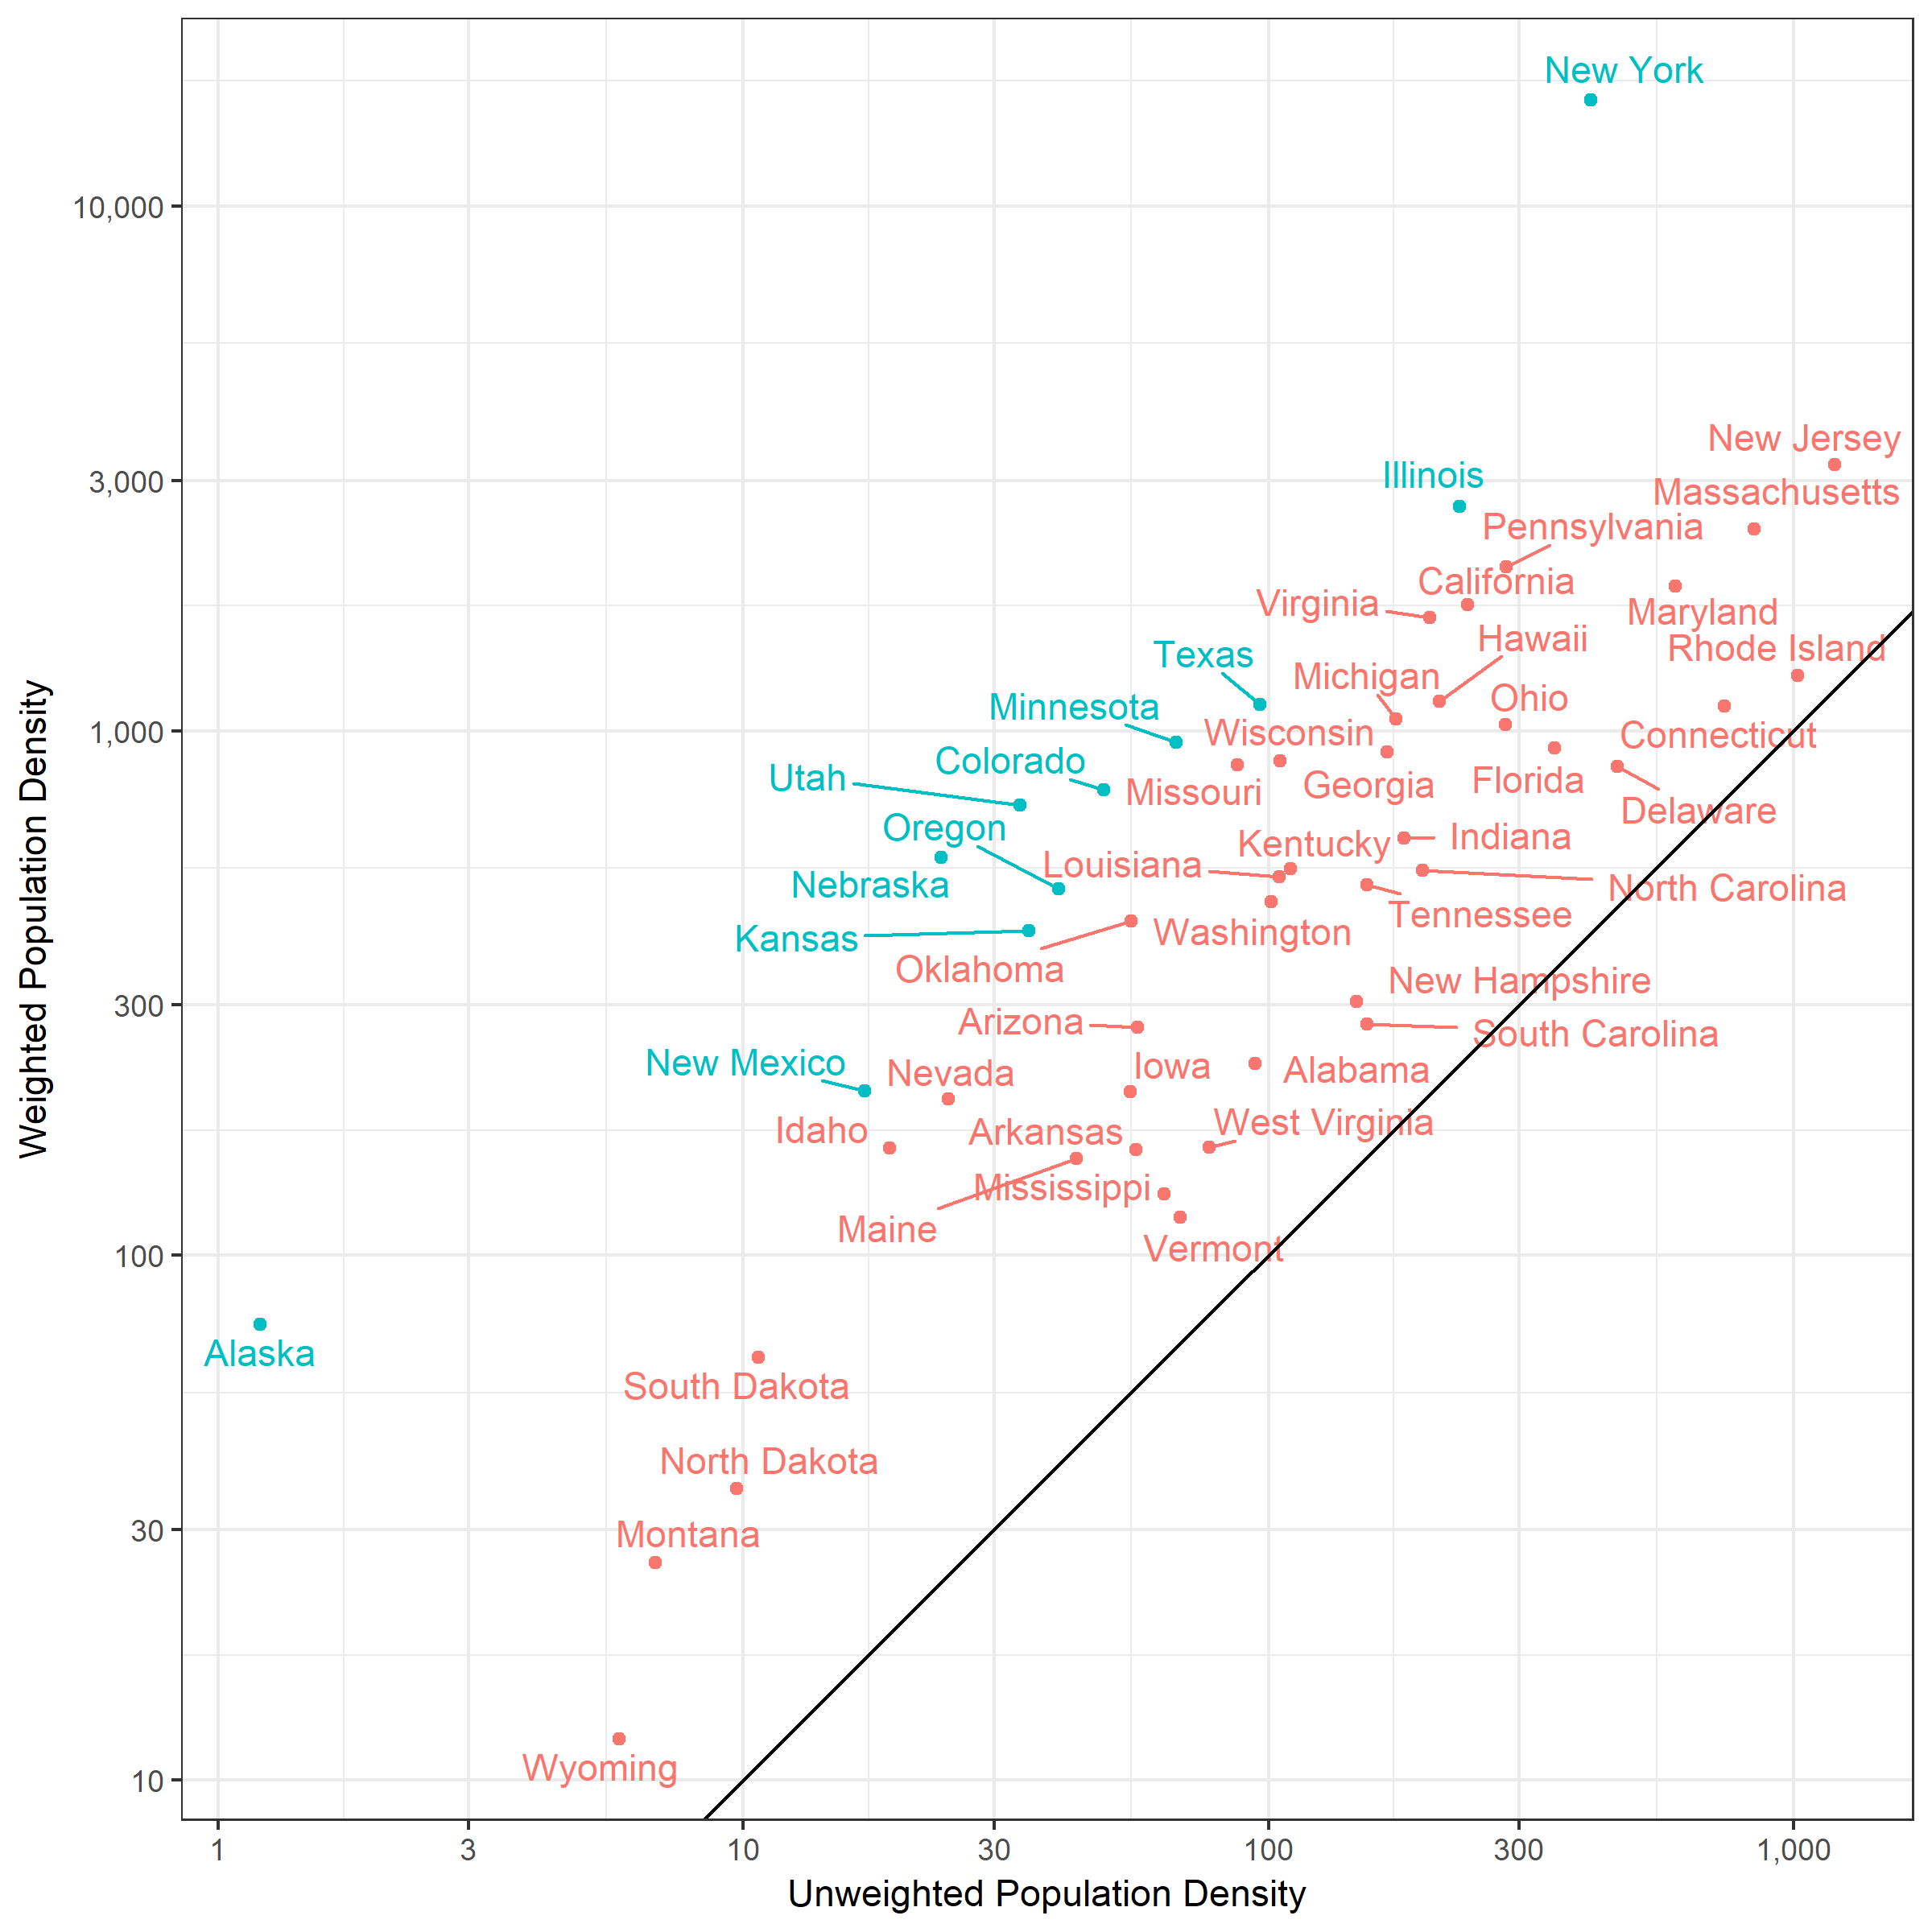
CLICK TO ENLARGE
Here are the states with the biggest ratios:
Alaska – The average person experiences a population density that is 62 times greater than the state’s density.
New York – 39 times
Nebraska – 24 times
Utah – 21 times
Colorado – 16 times
Minnesota – 14 times
Oregon – 13 times
New Mexico – 12 times
Kansas – 12 times
Texas – 12 times
Illinois – 12 times
R CODE FOR THOSE WHO WISH TO FOLLOW ALONG AT HOME
Want to tinker with this yourself?
Here have the data, or download it from the URL in the source code.
H/T Jake Hofman for getting me to do this and talking R.
H/T to Hadley Wickham for creating the tidyverse.


In effect this uses the county level data to improve understanding at the state level of aggregation. The approach is well known to GISC. Try googling dasymetric mapping for an even better way of using additional data at one level of spatial aggregation to eztimatve density at another. I find converti g density to mean distance to nearest person makes for interesting maps.
June 28, 2017 @ 3:12 am
This is epic! Really nice visualization and explanation of what you were doing here. As a resident of Colorado, it’s interesting to be in the top 10. If there is more data split out over multiple years perhaps I’ll take a shot at making this same plot animated to illustrate changes over the years.
June 28, 2017 @ 8:24 am
To be precise: average weighted population density doesn’t show the density average person experiences. To measure density of average person, we would have to calculate ‘median’ weighted density (i.e. such density level, that 50% of popualtion live in counties with same or higher density and 50% of population in counties with same or lower density)
For hypothetical state where 40% of population lives in dense metro, and 60% are scattered across the rest of the state, average weighted density and density of average person will be very different
January 14, 2019 @ 4:43 am
I have calculated the census tract level data for the 2010 Census.
New York is even more striking, and Mississippi takes the least dense position as more of the emptiness in the western states is discounted.
New York — 28,161.5
Hawaii — 8,479.7
California — 8,213.0
New Jersey — 7,940.6
Illinois — 6,660.8
Massachusetts — 6,585.6
Nevada — 5,419.5
Rhode Island — 5,034.0
Pennsylvania — 4,886.8
Maryland — 4,555.0
Florida — 3,750.6
Connecticut — 3,583.0
Arizona — 3,582.5
Colorado — 3,500.0
Utah — 3,429.9
Washington — 3,344.8
Virginia — 3,249.6
Texas — 3,138.6
Oregon — 3,113.8
Delaware — 2,643.5
Wisconsin — 2,598.5
Michigan — 2,527.3
Minnesota — 2,416.5
Ohio — 2,388.8
Nebraska — 2,285.2
New Mexico — 2,108.8
Louisiana — 1,931.2
Missouri — 1,895.7
Alaska — 1,834.1
Kansas — 1,772.6
Indiana — 1,740.0
Oklahoma — 1,602.3
North Dakota — 1,569.1
Georgia — 1,550.9
Idaho — 1,488.8
Kentucky — 1,464.2
Iowa — 1,463.1
New Hampshire — 1,320.9
Tennessee — 1,288.4
North Carolina — 1,181.9
Montana — 1,088.3
South Dakota — 1,045.9
South Carolina — 1,018.7
Wyoming — 998.5
Vermont — 947.2
Alabama — 942.2
Maine — 881.7
Arkansas — 807.9
West Virginia — 792.1
Mississippi — 694.9
July 2, 2019 @ 8:53 pm