Part 2 of Who We Are: Society for Judgment and Decision Making (SJDM)
WHERE THE SJDM MEMBERS ARE FROM IN THE WORLD
Last week, we looked at where the Society for Judgment and Decision Making members were from in terms of academic areas. This week we look at where they’re from geographically.
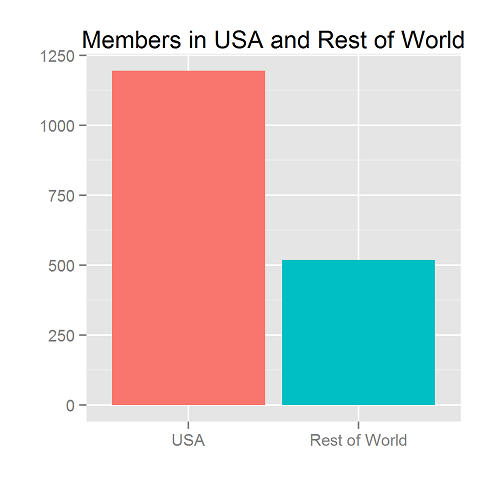
To start, we note that most members (1195/1714 or 70%) are from the USA.
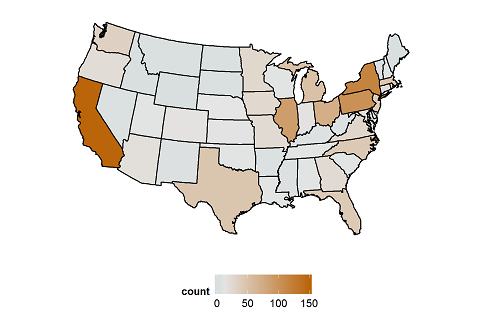
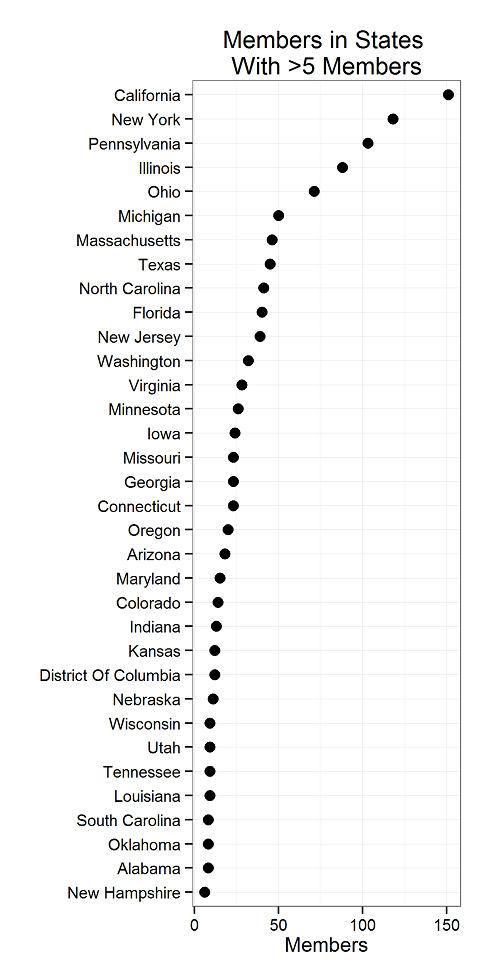
Inside the USA, there are members in 45 states, as seen at the top of the page. The states with more than 5 members are these:
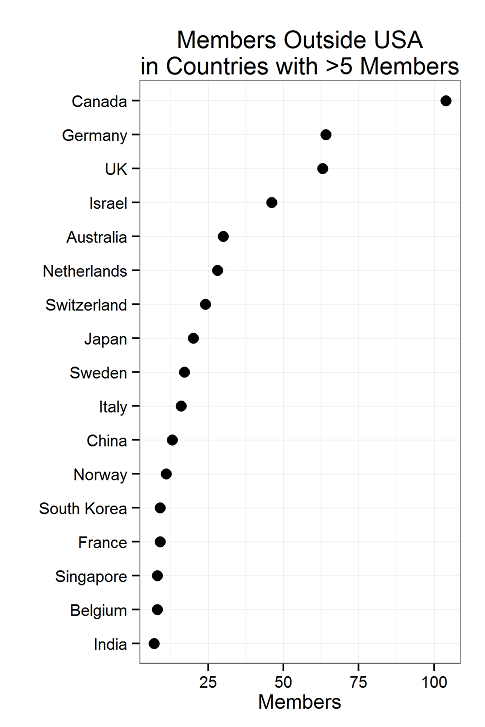
Outside the US, we have members in North America, Europe, Asia, Oceania, South America and Africa.
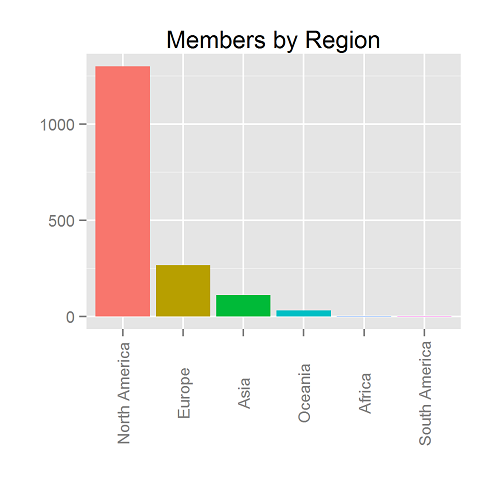
And those regions comprise 39 countries. Here are the countries with more than 5 members.
Now, you’re probably wanting to reproduce these graphs. Or, if you’re like most people, you aren’t.
You’ll need directory.csv.gz, state_table.csv.gz, and regions.csv.gz. And the code below.
H/T to @winston_chang’s R Graphics Cookbook, from which I borrowed a code snippet or two.

The state plot mostly reflects relative state population densities. How would the graph change if the membership were divided by state population?
October 7, 2014 @ 12:13 pm
Interesting… I just ran the analysis on SJDM/100,000 population and discovered that the hot beds are Arizona (2.44) and DC (1.86). Next closest were Pennsylvania (.81) and Iowa (.69). The rest varied between .03 (Arkansas) and Massachusetts (.69).
In general, the South and parts of the West (Dakotas, MT, ID, WY, NV) were below average whereas the West Coast, most of the Midwest, and most of the Northeast were above.
October 7, 2014 @ 12:37 pm
Dan this is really interesting. Thanks!
Concerning your graphs here
http://www.decisionsciencenews.com/2014/10/01/society-judgment-decision-making-sjdm/,
it would be really interesting to compare the distribution of membership across departments to the distribution of spoken presentations at JDM across departments. I would presume that an unbiased review process for determining spoken presentations would reflect the membership probability distribution.
October 7, 2014 @ 1:03 pm
CA rules! But I wonder: this year’s SJDM conference is in California and membership renewal/sign-up is basically part of the conference registration, so one’s current membership is determined in no small part by whether or not one is going to the conference. Obviously more people from California are goint this year than in previous year, whereas on the east coast we should see the opposite trend. This may also account for the large number of Canadians that registered to last year’s conference in Toronto and whose membership has not lapsed yet.
October 8, 2014 @ 8:40 am