R video tutorial number 1
LEARN R BY JUST WATCHING
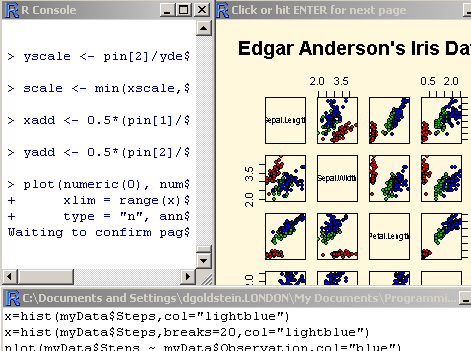
For this week, Decision Science News has created a video tutorial on how to get started using the R Language for Statistical Computing. (The tutorial is best viewed in your browser’s full-screen mode, try pressing F11 in Windows). R is free and open source, and constantly being improved upon by countless contributors worldwide. DSN highly recommends using R.
Hi Res Version at: http://www.dangoldstein.com/flash/Rtutorial1/Rtutorial1.html
Topics covered include:
- Downloading and installing R in Windows
- The R graphical user interface
- Viewing the graphics demo
- Vectors and basic stats
- Simple plotting
The commands in the tutorial are:
demo(graphics)
x=c(1,2,3,4,5,6,7)
y=c(10,14,20,18,16,15,10)
x+y
z=c(x,y)
sum(y)
mean(y)
sd(y)
plot(x,y)
barplot(y,col=”lightgreen”)
Got that? Now try R video tutorial 2
See also The R Graph Gallery
Can’t view flash? Download movie. If you see no image under Windows, download the TSSC Codec.


